Most LinkedIn users track the wrong metrics and waste time chasing meaningless numbers. They celebrate post likes while having no idea if their content actually generates business. The cold truth? If you're not measuring what matters, you're just creating content for digital applause. This guide cuts through the vanity metrics to reveal the LinkedIn analytics that actually predict business results in 2025 – the numbers agency owners and founders should obsessively track if they want their LinkedIn efforts to deliver more than just notifications.
LinkedIn Analytics im Jahr 2025 verstehen
Die Analysefunktionen von LinkedIn haben sich erheblich weiterentwickelt und bieten Fachleuten tiefere Einblicke in die Leistung ihrer Inhalte, die Interaktion mit dem Publikum und die Auswirkungen auf das Geschäft. Für Agenturinhaber, die sich auf Ergebnisse konzentrieren, ist das Verständnis dieser Metriken entscheidend für die Optimierung ihrer LinkedIn-Strategie.
Wo finde ich LinkedIn Analytics?
LinkedIn bietet Analysen über mehrere Zugangspunkte:
-
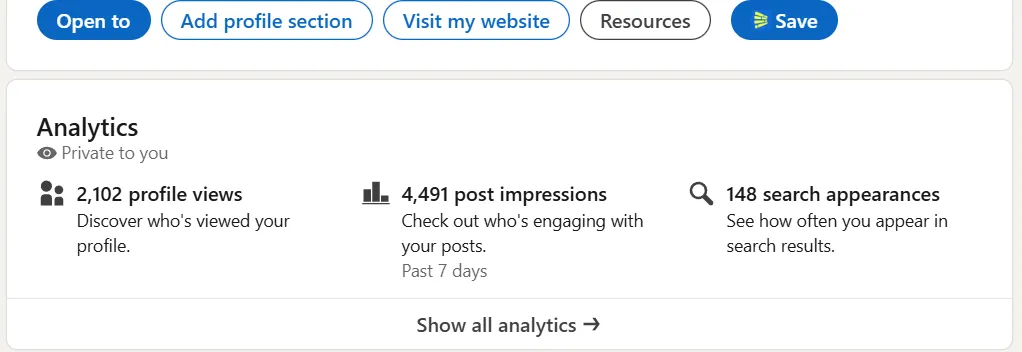
Analyse persönlicher Profile : Greifen Sie auf grundlegende Metriken zu Ihrem persönlichen Profil zu, indem Sie im Dropdown-Menü auf "Profil anzeigen" und dann auf "Analytics" klicken.
-
Analyse von Unternehmensseiten : Find comprehensive page analytics by navigating to your company page and clicking the "Analytics" tab
-
Inhaltsanalyse : Zeigen Sie Leistungskennzahlen für einzelne Beiträge direkt unter jedem Beitrag an.
-
Kampagnen-Manager : Greifen Sie über die Campaign Manager-Plattform von LinkedIn auf detaillierte Werbemetriken zu
These native analytics provide valuable baseline data, though many professionals supplement them with third-party tools for deeper insights. For a comprehensive understanding of what data is available, see our guide on LinkedIn analytics hierarchy.
Essential LinkedIn Marketing Metrics to Track
Die effektivste LinkedIn-Analysestrategie konzentriert sich auf Metriken, die direkt mit den Geschäftszielen verbunden sind, und nicht auf Eitelkeitszahlen. Hier sind die wichtigsten Kennzahlen, die Agenturinhaber priorisieren sollten:
Zielgruppenwachstum und Qualitätsmetriken
Gesamtzahl der Follower : The total number of current followers your business page has, providing a baseline measurement of your audience size.
Wachstumsrate der Follower : This shows how the number of your brand's followers has increased (or decreased) over a set period, indicating momentum and content resonance.
Demografie der Follower : This metric breaks down who's following your page by categorizing them into industries, seniority levels, and locations, helping you understand if you're attracting your target audience.
Demografie der Besucher : Understanding the job titles, company sizes, industries, locations, and seniority of your visitors can help inform your content strategy and identify emerging market opportunities.
Unser guide on LinkedIn profile optimization explains how to align your profile with your target audience demographics.
Engagement-Metriken
Engagement-Rate : LinkedIn calculates engagement rate by adding interactions, clicks, and new followers acquired, divided by impressions. This comprehensive metric indicates how well your content resonates with your audience.
Reaktionen : The number of people who reacted to your post using LinkedIn's reaction options (Like, Celebrate, Support, Funny, Love, Insightful, Curious). Getting reactions means your content has elicited an emotional response.
Kommentare : The total number of comments on your posts, indicating conversation-starting potential. Comments typically carry more weight in LinkedIn's algorithm than reactions, as detailed in our LinkedIn comment impressions guide.
Aktien : The number of times your content was shared by LinkedIn users, extending your reach to new audiences.
Post-Klicks : The number of times users clicked on links, media, or your organization's page from your post during a specific timeframe.
Metriken zur Content-Performance
Eindrücke : The number of times your post was shown to LinkedIn users, indicating overall reach.
Click-Through-Rate (CTR) : The percentage of clicks divided by impressions, showing how effectively your content drives action.
Video-Aufrufe : The number of times your video content was watched, with LinkedIn counting a view after just 3 seconds.
Leistung von Dokumenten/Karussells : Metrics specific to document posts, including slide-through rates and average time spent per slide. Our LinkedIn carousel post guide provides optimization strategies for this high-performing format.
Leistung des Inhaltstyps : Vergleichende Analyse, wie verschiedene Inhaltsformate (Texte, Bilder, Videos, Dokumente) bei Ihrer spezifischen Zielgruppe ankommen.
Lead Generation Metrics
Lead Generation Rate: Measures the effectiveness of your LinkedIn marketing in converting viewers into potential customers.
Cost Per Lead (CPL): For paid campaigns, this metric divides total campaign cost by the number of leads generated.
Lead Conversion Rate: The percentage of leads that convert to the next stage in your sales process.
Lead to Customer Conversion Rate: The percentage of LinkedIn-generated leads that ultimately become customers.
For strategies to optimize these metrics, see our LinkedIn lead generation guide for agencies.
Advanced Analytics Approaches for Agency Owners
Beyond tracking individual metrics, these advanced analytics approaches help agency owners extract maximum value from their LinkedIn data:
Wettbewerbsorientiertes Benchmarking
LinkedIn bietet mehrere Metriken, um Ihre Leistung mit der der Konkurrenz zu vergleichen:
Vergleich von Follower-Metriken : Vergleichen Sie Allzeit-Follower und neue Follower, die innerhalb eines bestimmten Zeitraums gewonnen wurden, mit Seiten von Mitbewerbern.
Vergleich der Gesamtbeitragsmetriken : Vergleichen Sie Ihre Posting-Häufigkeit und Ihr Engagement mit denen Ihrer Mitbewerber in den letzten 30 Tagen.
Vergleich der Gesamtengagement-Metriken : Analysieren Sie, wie Ihr Engagement im Vergleich zu ähnlichen Unternehmen in Ihrer Branche abschneidet.
Trendige Beiträge von Mitbewerbern : Identifizieren Sie herausragende Beiträge von Mitbewerbern, um Ihre Content-Strategie zu informieren.
Diese Wettbewerbsinformationen helfen Ihnen, Branchenstandards zu verstehen und Möglichkeiten zur Differenzierung Ihres Ansatzes zu identifizieren.
Analyse der Content-Optimierung
Durch die Analyse Ihrer leistungsstärksten Inhalte können Sie Muster erkennen, die Ihre laufende Strategie beeinflussen:
-
Thema Performance : Verfolgen Sie, welche Themen die größte Interaktion mit Ihrer Zielgruppe erzeugen
-
Effektivität des Formats : Ermitteln Sie, welche Content-Formate (Textbeiträge, Karussells, Videos usw.) die besten Ergebnisse erzielen
-
Optimales Timing : Identify the days and times when your audience is most receptive to your content, as explored in our best time to post on LinkedIn guide
-
Resonanz beim Messaging : Analysieren Sie, welche Arten von Hooks, Handlungsaufforderungen und Wertversprechen die stärkste Reaktion hervorrufen
Diese Analyse sollte in eine datengesteuerte Content-Strategie einfließen, anstatt sich auf generische Best Practices zu verlassen.
ROI-Messung
Für Agenturinhaber ist es wichtig, LinkedIn-Bemühungen mit Geschäftsergebnissen zu verbinden:
-
Nachverfolgung der Namensnennung : Verwenden Sie UTM-Parameter und Tracking-Links, um Website-Traffic, Leads und Conversions bestimmten LinkedIn-Aktivitäten zuzuordnen
-
Einfluss der Pipeline : Verfolgen Sie, wie das LinkedIn-Engagement mit der Entwicklung der Vertriebspipeline und dem Fortschritt von Geschäften korreliert
-
Kosten für die Kundenakquise : Calculate the total investment in LinkedIn (including time and tools) divided by the number of clients acquired through the platform
-
Verhältnis von Lebenszeitwerten : Vergleichen Sie den Lifetime Value von LinkedIn-akquirierten Kunden mit denen aus anderen Kanälen
These metrics help justify LinkedIn investments and optimize resource allocation, as detailed in our guide on using analytics to improve your LinkedIn content strategy.
LinkedIn Analytics Tools for Agency Owners
While LinkedIn's native analytics provide valuable insights, specialized tools can enhance your analytics capabilities:
Premium Analytics Solutions
LiGo : The most comprehensive LinkedIn analytics solution designed specifically for agency owners and founders. LiGo combines AI-powered theme analysis, content performance metrics, and predictive insights in a single platform. The advanced analytics dashboard provides engagement pattern recognition, optimal posting time analysis, and real-time ROI tracking. Unlike general social media tools, LiGo's analytics are optimized for business outcome measurement, not just engagement metrics. Pricing starts at $29/month with significant value advantage over general-purpose tools.
General Social Media Platforms
Sprossen Soziale Netzwerke : Offers powerful LinkedIn analytics with visualization capabilities, performance summaries, and competitive analysis. Pricing starts at $199 per month with a 30-day free trial.
SocialInsider: Provides engagement evolution tracking, competitor analysis, and detailed post analytics to inform your content strategy. Pricing starts at $149 per month with a 14-day free trial.
Brand24: Focuses on social listening insights, sentiment analysis, and hashtag analytics to measure brand awareness and campaign effectiveness. Pricing starts at $99 per month with a 14-day free trial.
Other Specialized LinkedIn Tools
Inlytics: A LinkedIn-specific analytics and scheduling tool providing real-time and historic visualizations of content performance. Pricing starts at $12.50 per month with a free plan offering limited analytics.
Shield Analytics: Particularly valuable for thought leadership clients who appreciate comprehensive reports on organic content performance. Pricing varies based on features.
Tapilo: Used for collecting content ideas and auditing profiles of fellow LinkedIn creators to inform your strategy.
For a complete comparison of tools including LiGo, see our LinkedIn tools for agency owners guide.
Enterprise-Level Solutions
Iconosquare: Provides comprehensive engagement insights and audience demographics visualization. Pricing starts at $49 per month with a 14-day free trial.
Talkwater: Offers powerful analytics for audience insights, social benchmarking, media monitoring, and social listening. Pricing available upon request.
Improvado: Aggregates data from various social networks to understand the overall impact of LinkedIn campaigns with easy visualization. Pricing not publicly available.
Wie Sie LinkedIn Analytics nutzen können, um Ihre Strategie zu verbessern
Für Agenturinhaber und -gründer liegt der wahre Wert von Analysen darin, wie Sie diese Erkenntnisse anwenden, um Ihre LinkedIn-Strategie zu verbessern:
1. Legen Sie klare KPIs fest, die auf die Geschäftsziele abgestimmt sind
Bevor Sie sich mit Metriken befassen, sollten Sie spezifische, messbare Ziele für Ihre LinkedIn-Präsenz festlegen:
-
Markenbekanntheit und Autoritätsaufbau
-
Lead-Generierung und Interessentenpflege
-
Talentakquise und Employer Branding
-
Entwicklung und Vernetzung von Partnerschaften
-
Kundenbindung und Beziehungsmanagement
Each objective requires tracking different metrics and implementing different optimization strategies, as outlined in our LinkedIn marketing guide.
2. Implementieren Sie einen regelmäßigen Analyseüberprüfungsprozess
Legen Sie einen konsistenten Zeitplan für die Analyse Ihrer LinkedIn-Leistung fest:
-
Wöchentliche Schnellbewertungen : Überprüfen Sie grundlegende Engagement-Metriken und reagieren Sie auf Trends
-
Monatliche Deep Dives : Analysieren Sie Performance-Muster und das Wachstum des Publikums
-
Vierteljährliche strategische Bewertungen : Bewerten Sie die Auswirkungen auf das Geschäft und passen Sie den Gesamtansatz an
Dieser strukturierte Ansatz stellt sicher, dass Sie konsequent aus Ihren Daten lernen, anstatt Metriken zu sammeln, ohne etwas zu unternehmen.
3. Segmentieren Sie Ihre Analysen nach Inhaltskategorien
Anstatt alle Inhalte zusammen zu analysieren, segmentieren Sie Ihre Analysen nach:
-
Inhaltsthemen oder Themen
-
Inhaltsformate (Text, Bild, Video, Dokument)
-
Inhaltliche Ziele (Bildung, Werbung, Engagement)
-
Zielgruppen-Segmente
This segmentation reveals which content types work best for specific goals and audiences. Our content plan guide provides a framework for effective content categorization.
4. Systematisch testen und messen
Implementieren Sie einen strukturierten Testansatz, um die Leistung kontinuierlich zu verbessern:
-
Stellen Sie eine klare Hypothese auf (z. B. "Beiträge mit Datenvisualisierungen erzeugen ein höheres Engagement als reine Textbeiträge")
-
Erstellen von Testinhalten, die die Variable, die Sie testen, isolieren
-
Messen der Ergebnisse anhand des Inhalts der Steuerelemente
-
Erfolgreiche Ansätze auf breiterer Basis umsetzen
-
Dokumentieren Sie das Gelernte zum späteren Nachschlagen
Dieser wissenschaftliche Ansatz liefert zuverlässigere Erkenntnisse als zufällige Experimente.
How LiGo Enhances LinkedIn Analytics for Agency Owners
For agency owners seeking deeper insights and more efficient LinkedIn management, LiGo offers several advanced analytics features that transform data into actionable strategy:
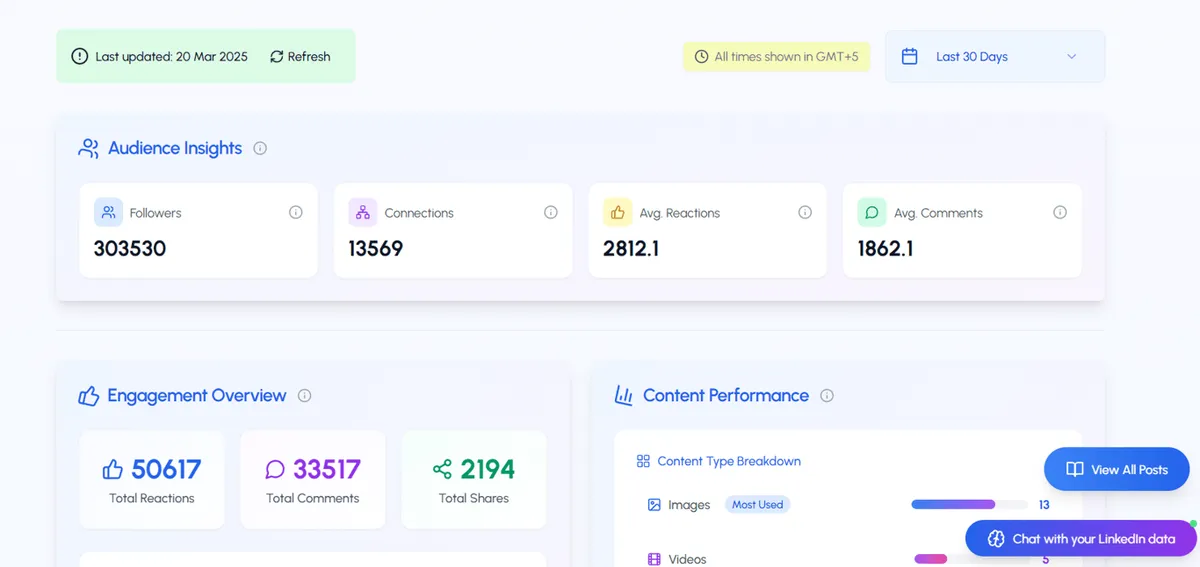
1. Comprehensive Analytics Dashboard
LiGo's Analyse-Dashboard provides a centralized view of your LinkedIn performance metrics, making it easy to track results without switching between multiple platforms. The system tracks:
-
Audience details (followers, connections, engagement averages)
-
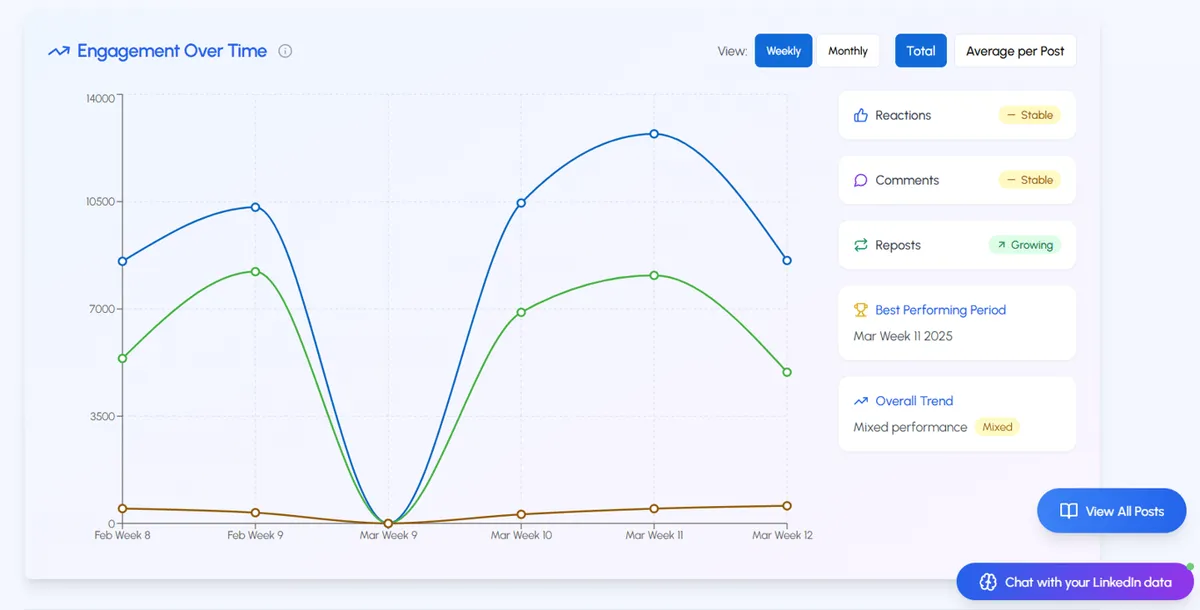
Engagement overview with visualization of reaction types
-
Content type breakdown showing performance by format
-
Day and time analysis for optimal posting scheduling
-
Posting patterns and consistency metrics
-
Content strategy insights based on media type and length
This consolidated view saves agency owners hours of manual analysis while providing deeper insights than LinkedIn's native analytics.
2. Theme-Based Performance Analysis
LiGo's unique theme-based approach allows you to track which content themes and topics generate the strongest engagement with your specific audience. This enables you to:
-
Compare performance across different expertise areas
-
Identify which themes drive engagement vs. conversions
-
Optimize your content mix based on business objectives
-
Focus your limited time on themes with proven results
Unlike generic analytics tools, LiGo connects performance data directly to your content strategy, providing context-rich insights.
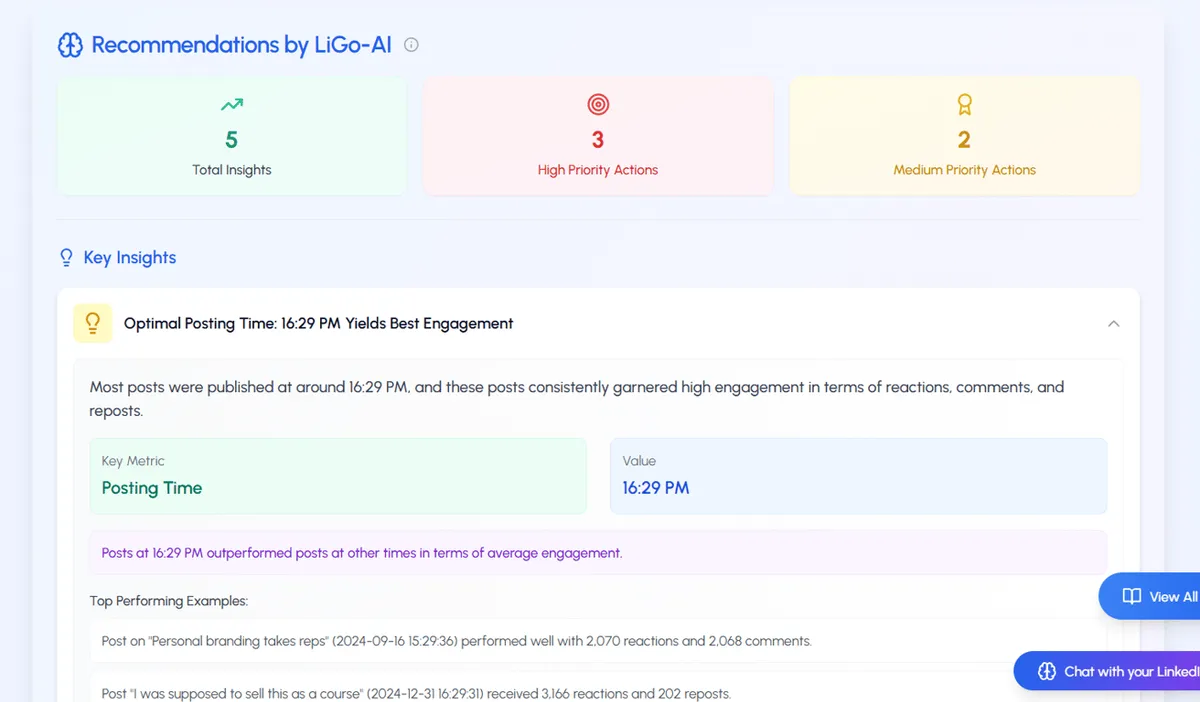
3. AI-Powered Analytics Interpretation
LiGo goes beyond raw data with AI-generated insights that identify patterns and recommend specific actions to improve performance:
-
Posting time analysis based on your actual audience behavior
-
Content type performance insights with concrete improvement suggestions
-
Theme and topic performance evaluation with context-specific recommendations
-
Engagement pattern analysis that reveals what triggers responses
-
Network growth opportunities based on engagement patterns
These AI insights transform complex data into clear, actionable recommendations tailored to your specific audience and content strategy.
4. Interactive Data Exploration
LiGo's chat interface allows you to interrogate your LinkedIn data and receive instant insights about specific aspects of your performance:
-
Ask questions like "Which posts drove the most profile views last month?"
-
Request comparative analysis such as "How do my case study posts perform versus how-to content?"
-
Get specific recommendations: "What should I post next Tuesday for maximum engagement?"
-
Explore performance trends: "Is my engagement increasing or decreasing over time?"
This interactive capability makes analytics accessible even to users without data analysis expertise, democratizing insights for the entire agency team.
5. Predictive Performance Modeling
Based on historical performance data, LiGo can predict how future content is likely to perform before you publish:
-
Estimate engagement ranges for draft content
-
Identify potential improvements to increase performance
-
Recommend optimal posting times for specific content types
-
Suggest audience targeting adjustments based on past performance
This predictive capability helps agency owners make strategic decisions about content investment, focusing resources on approaches with the highest probability of success.
Case Study: Agency Analytics Transformation
Sarah, an agency owner specializing in B2B services, transformed her LinkedIn analytics approach using LiGo:
Previous Challenge:
-
Overwhelmed by disconnected metrics across platforms
-
Unable to translate data into clear strategic decisions
-
Spending 3-4 hours weekly on manual analytics review
-
Struggling to prove LinkedIn ROI to justify time investment
Implementation Strategy:
-
Consolidated all analytics within LiGo's dashboard
-
Established KPIs aligned with specific business goals
-
Implemented monthly content performance reviews
-
Used AI insights to guide content strategy adjustments
Results After 90 Days:
-
85% reduction in analytics processing time
-
143% increase in content engagement
-
Identified three high-converting content themes
-
Directly attributed 4 new client acquisitions to LinkedIn
-
Clear data showing 327% ROI on LinkedIn time investment
"LiGo transformed LinkedIn from a black box into a transparent, measurable business channel," Sarah noted. "I now have concrete data showing which content drives actual business results, not just likes and comments."
Conclusion: From Metrics to Meaningful Results
Für Agenturinhaber und Gründer sollte es bei LinkedIn Analytics niemals darum gehen, Zahlen um ihrer selbst willen zu sammeln. Der wahre Wert liegt darin, diese Erkenntnisse in strategische Entscheidungen umzusetzen, die Ihre berufliche Präsenz verbessern und das Geschäftswachstum vorantreiben.
Der effektivste Ansatz kombiniert:
-
Klare Geschäftsziele, die an bestimmte Metriken gebunden sind
-
Regelmäßige Analyse der Leistungsdaten
-
Strategische Anpassungen auf Basis von Erkenntnissen
-
Kontinuierliches Testen und Optimieren
By implementing the analytics framework outlined in this guide, you can transform your LinkedIn presence from a time-consuming obligation into a data-driven business development engine-generating qualified leads, establishing industry authority, and building valuable relationships that convert into business opportunities.
Denken Sie daran, dass LinkedIn-Analysen ein fortlaufender Prozess und keine einmalige Bewertung sind. Die Fachleute, die den größten Erfolg erzielen, sind diejenigen, die ihren Ansatz konsequent messen, lernen und anpassen, und zwar auf der Grundlage echter Leistungsdaten und nicht auf Annahmen oder generischen Best Practices.
Ready to transform your LinkedIn analytics approach? Testen Sie LiGo noch heute and discover how our advanced analytics capabilities can help you make data-driven decisions that drive real business results.
Verwandte Ressourcen
Want to further enhance your LinkedIn analytics approach? Check out these related guides:
-
Der ultimative Leitfaden für LinkedIn Analytics: Was tatsächlich zu Ergebnissen führt
-
LinkedIn Analytics Hierarchy: What to Track at Each Stage of Brand Building
-
Wie Sie Analysen nutzen können, um Ihre LinkedIn-Content-Strategie zu verbessern
-
Lohnt es sich, auf LinkedIn zu posten? Datengestützte Antwort
-
LinkedIn Content Plan: Erstellen einer Strategie, die zu Ergebnissen führt